Flow Automation
A visual flow graph instead of an action list. Error paths are first-class citizens, not afterthoughts.
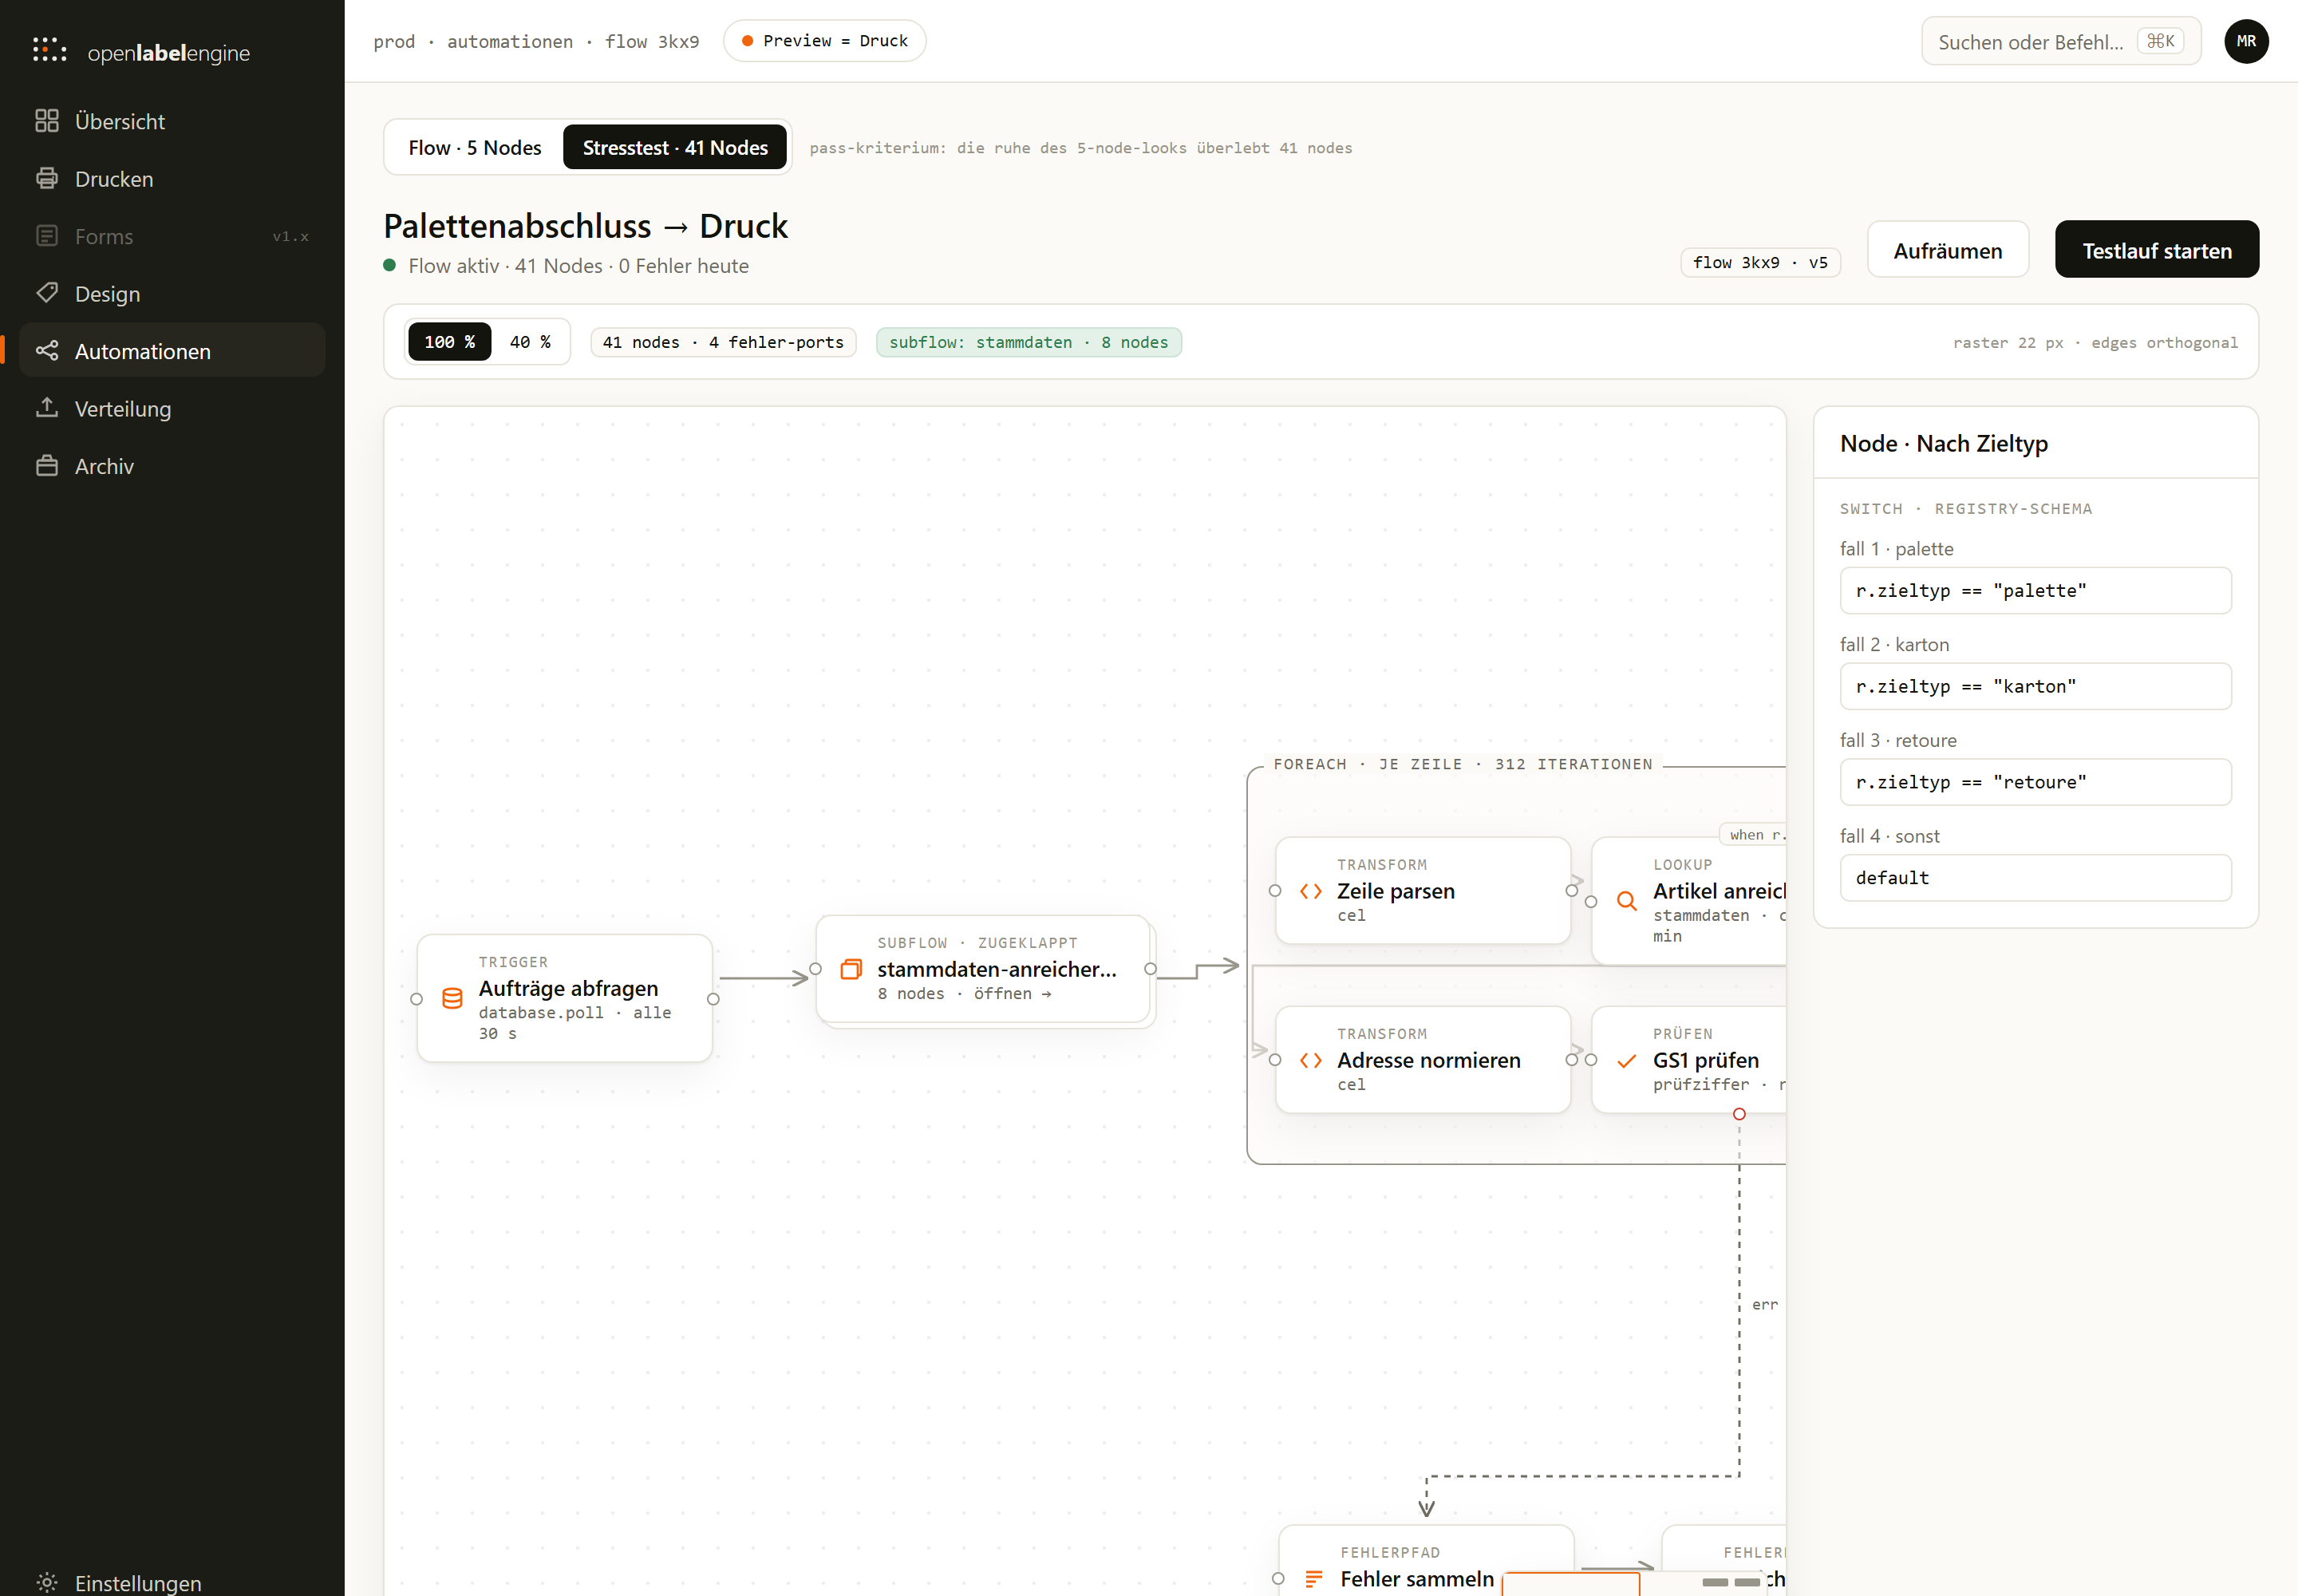
A flow with webhook trigger → CEL transform → GS1 validation (with error path) → print node. The error path routes failed rows to a notification node — they are configuration, not failure states.
Test before you go live.
Step-through test mode lets you walk through a flow one node at a time with sample data. See what each step does before anything reaches a printer.
- DB-Poll watches your ERP tables for new orders
- Error paths route failed rows to notifications or retry queues
- Step-through shows data pins at every node
- Inline label preview at each print node
- "0 errors today" is the normal state — error edges stay slate-colored until something actually fails
Triggers, CEL, and flow.json.
Every trigger type connects to your existing infrastructure:
// Map CSV rows to labels with quantity
rows.map(r, label(r, int(r.menge)))

// GS1 validation
${gs1.check_digit(sscc)} && ${quiet_zone >= 2.0}
Flows are stored as flow.json — directed graphs with typed ports. Node inspectors are generated from the registry schema, same as the designer.
| Capability | How it works |
|---|---|
| Error paths | Drawn as dashed slate edges with port labels. They are healthy architecture — red is reserved for actually failed runs. |
| Step-through mode | Walk a flow with test data. Each node shows its input/output pins. Active path highlights in thermal. |
| Registry schemas | Node properties are defined in the same registry that powers the designer — one source of truth. |
Follow the data.
Webhook to CEL to GS1 Check to Print. The error path routes downward.
Automation Copilot: From prompt to flow.
“Poll our MSSQL orders table every 30 seconds, validate GS1, print on PAL-2, notify the shift on errors.” The copilot turns this into a working flow.json — because the node registry schemas are machine-readable tool definitions.